What is a Signal?
6 mins read - Updated on Sep 29, 2026Signals help you discover meaningful patterns in the customer feedback analyzed in your Report.
They highlight where feedback differs between groups and how those patterns change over time, making it easier to notice findings that might be difficult to spot by reviewing the data manually.
In short, Signals can help you answer questions such as:
- Which topics or experiences stand out in a certain group?
- Do certain personas, platforms, or contexts show different patterns from others?
- Are certain motivations, needs, strengths, or pain points becoming more or less common over time?
Sign in to your Kimola account and go to the Dashboard. To use Signals, you first need a report that contains analyzed customer feedback.
If you haven’t created one yet, you can Create a Report by Uploading a Custom Dataset or Create a Report by Adding Links. Once your report is ready, open it and select Signals from the left-hand menu.
How Signals Work
Signals are built on top of both the information already available in your dataset and the analysis Kimola creates from customer feedback.
Your dataset may include fields such as review text, date, URL, platform, product name, or product attributes. When you create a report, Kimola analyzes the review text and enriches it with additional analysis such as Personas, Motivations, Pain Points, Experience Contexts, Themes, and Sentiment. Kimola also analyzes sentiment at the theme level, so different themes mentioned within the same review can be evaluated separately.
Kimola then looks across the report for patterns that stand out. Rather than checking a single metric, the system evaluates many different combinations across the data and repeatedly asks, in effect: “Is something happening differently here than elsewhere?”
A Signal is not created simply because something is mentioned frequently. It is surfaced when a pattern appears noticeably more or less often in one group than in its comparison group, or when that pattern changes over time.
In the example below, Rapid Prototyping and MVP Creation appears much more often in Product Hunt reviews than in reviews from other platforms. The Signal is surfaced because of the difference between the two groups, not simply because the topic is mentioned frequently.
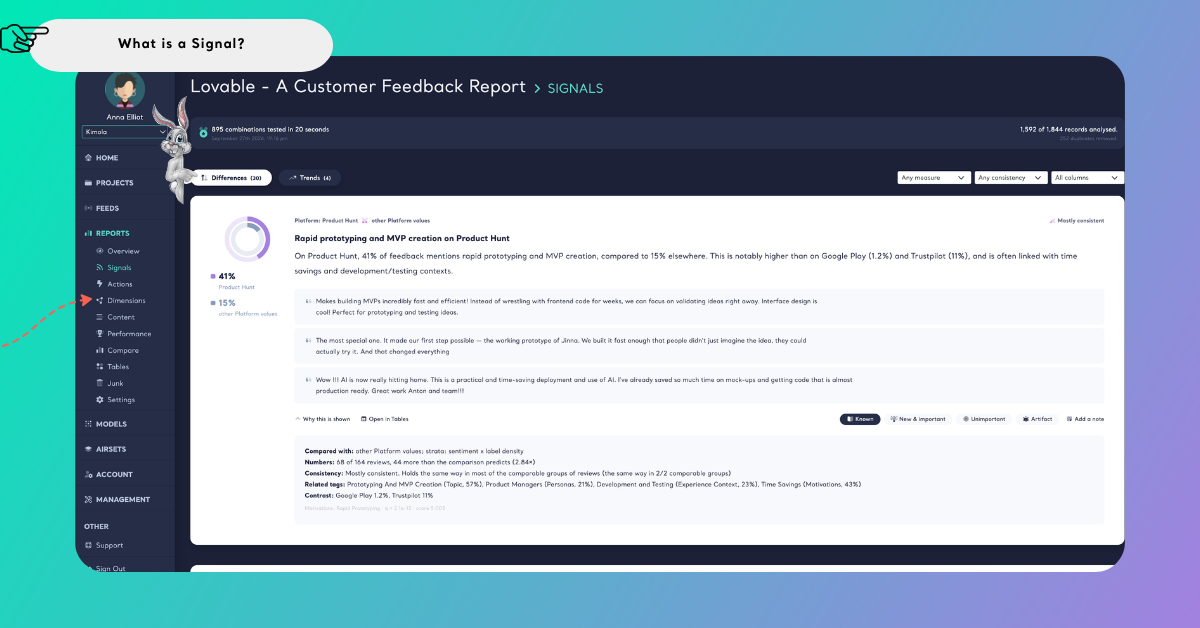
Signals are generated automatically when the report contains enough feedback and sufficient Dimensions for Kimola to identify meaningful patterns. If the dataset is too small or no Dimensions are selected, Signals may not be generated.
In other words, Signals go beyond simple counts and help reveal patterns that may be difficult to notice by reviewing individual comments or metrics one by one. These patterns are presented in two main ways: Differences and Trends.
Differences
Differences show where one group of feedback stands out compared with another group or with the rest of the dataset. Kimola may compare one platform with other platforms, or one analyzed group with the rest, to identify patterns that appear noticeably more or less often.
For each Difference, Kimola shows the group being analyzed, the comparison group, and the values behind the finding. This makes it easier to understand not only what is different, but also how large the difference is.
In the example below, Ease of Use appears more frequently among Non-Technical Users than in the comparison group.
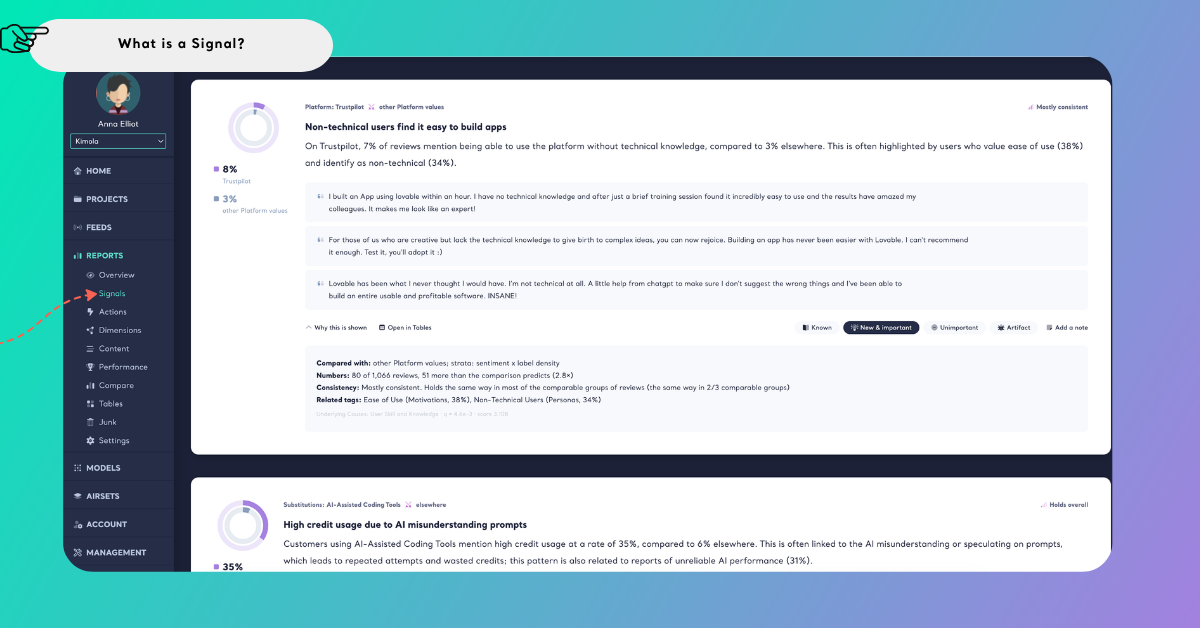
Differences can help you identify patterns such as a theme being especially common on one platform, a motivation being more prominent among a certain persona, or a pain point appearing more frequently in one experience context than in others.
Trends
Trends show how patterns in customer feedback change over time.
Instead of comparing one group with another, Kimola compares different time periods and highlights patterns that are becoming more or less common. This helps you notice shifts in customer experiences, needs, strengths, or pain points without manually checking each period.
For each Trend, Kimola shows the periods being compared and the values behind the change, making it easier to understand both the direction and the size of the shift.
In the example below, mentions of App Crashes and Instability are higher in the latest period than in the previous one. This indicates that stability-related feedback has become more common over time.
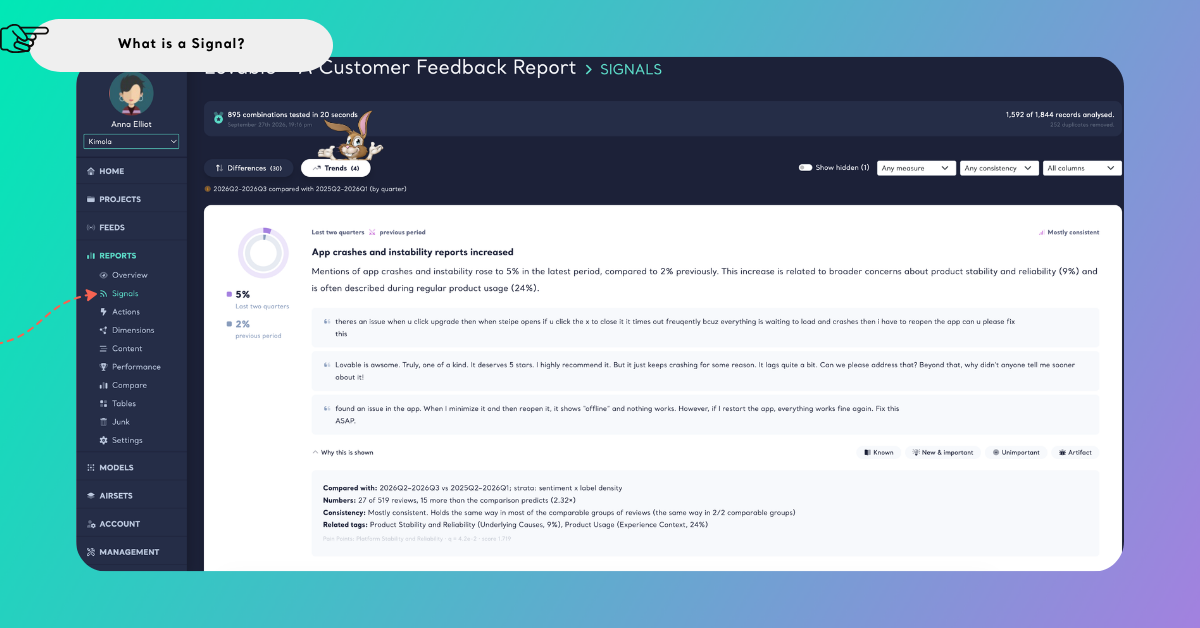
Trends can help you identify emerging issues, growing needs, increasing strengths, or topics that are becoming less common over time.
How to Read a Signal
Each Signal brings together the finding itself, the comparison behind it, and the evidence that supports it.
At the top of the card, you can see what is being analyzed and what it is being compared with. The title summarizes the main finding, while the values on the left show the size of the difference or change. When available, supporting reviews appear below so you can see how the pattern is reflected in customers’ own words.
To understand why Kimola surfaced a Signal, open Why this is shown. This section provides additional context about the finding and may include:
- Compared with — shows the group or period used for comparison
- Numbers — shows how many reviews are behind the finding and how strongly the result differs from the comparison
- Consistency — shows how stable the pattern is across comparable parts of the dataset. Labels such as Consistent, Mostly consistent, Holds overall, or Varies help you understand whether the same general pattern continues across different subgroups
- Related tags — highlights other labels that frequently appear alongside the Signal
- Contrast — when available, shows another group where the same pattern appears at a different rate
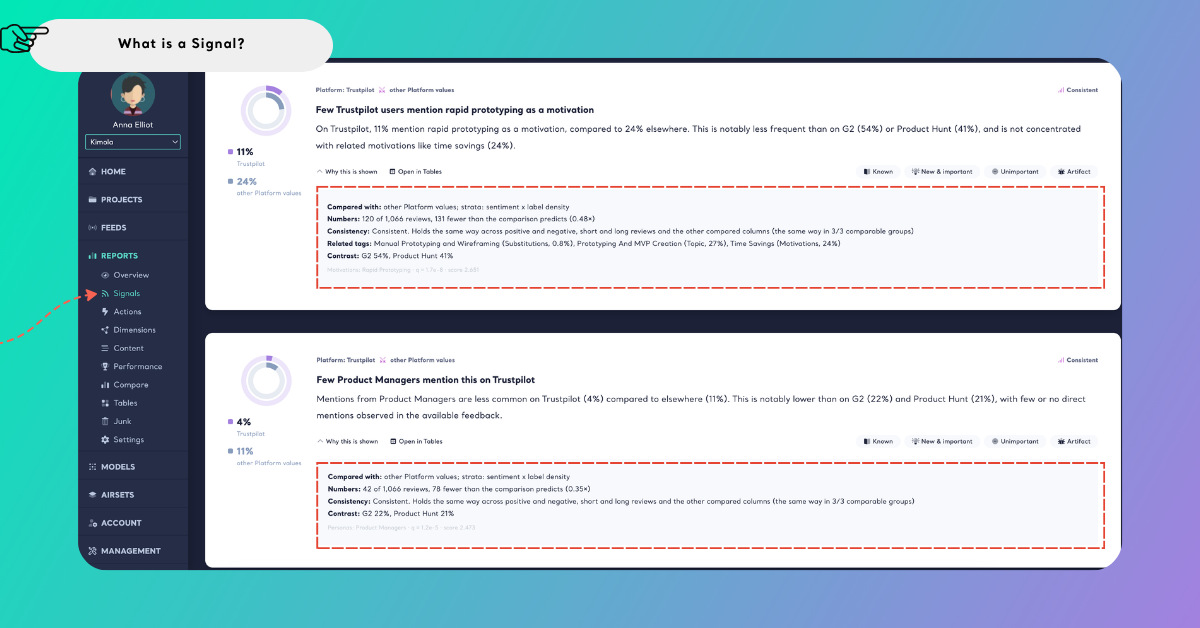
Related tags provide additional context around a Signal, but they do not necessarily mean that one tag causes another.
Explore and Review Signals
Signals are designed to help you continue exploring the findings in your report, not just view them as standalone insights.
You can select Open in Tables to inspect the feedback behind a Signal in more detail. This lets you review the individual records that contribute to the finding and continue your analysis from the Tables section.
You can also classify each Signal based on how you evaluate the finding:
- Known — the finding is already familiar to you or your team
- New & important — the finding is new and worth further attention
- Unimportant — the finding may be valid, but it is not relevant to your current analysis
- Artifact — the pattern appears in the data, but it may be caused by the data or analysis setup rather than reflecting a meaningful customer insight
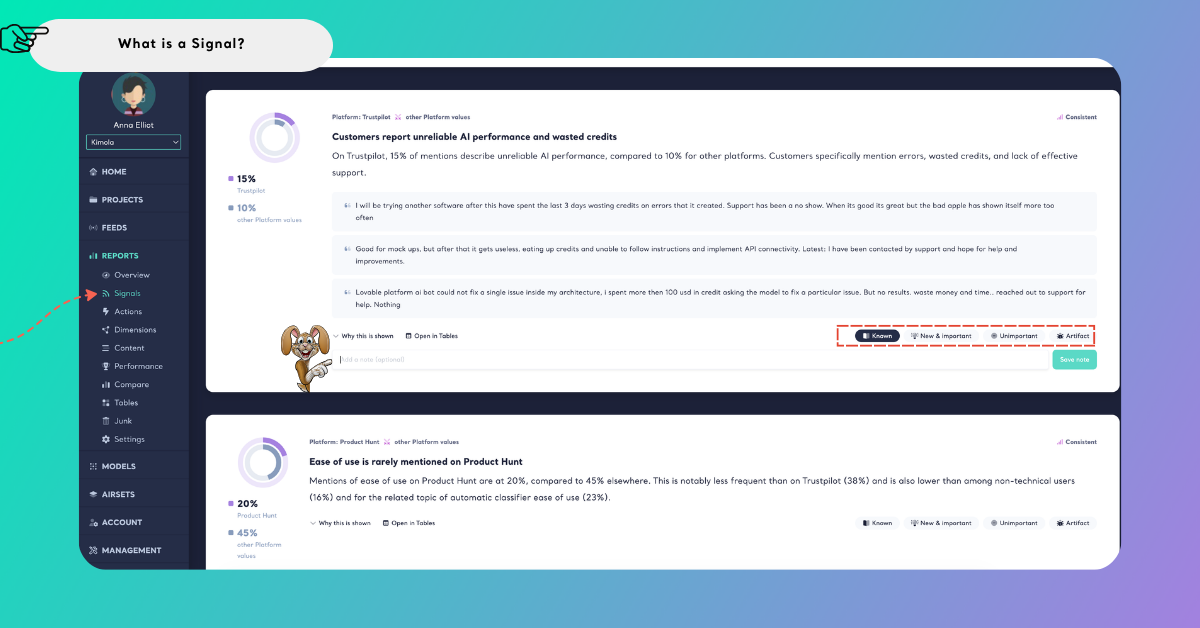
You can also add a note to a Signal to keep your own context, interpretation, or follow-up comments with the finding. Notes can be edited later if you want to update or refine them.
If your report contains many Signals, use the filters at the top of the page to narrow the results and focus on the findings most relevant to your analysis.
By bringing differences and changes in your feedback together, Signals make patterns easier to recognize without having to compare individual comments and metrics manually. You can then review the supporting feedback and decide which findings are most relevant to your analysis.
You can also use findings from your report to create Action Plans. To learn more, see What is an Action?.